kodbasen
Where the compass is spinning around software


Development Kubernetes Docker ARM Raspberry PI
This is the second part in a series about handling logs on Kubernetes-On-ARM.
In the first part we installed ELK and started sending syslog events from our
nodes using logstash-forwarder. In this part we will start collecting logs
from our pods and Kubernetes components. If you wan’t to cache up here’s a
list of previous posts:
The plan was that this part would be about how
to start collecting logs from Kubernetes. But I wasn’t satisfied with how
logstash-forwarder worked. The thing is that, once the logstash-forwarder
daemon is started, the node can’t run much else.
Another problem with the first attempt was that we were collecting syslog
messages instead of collecting logs directly from journald. There is no
syslog on Arch Linux by default. You need to install syslog-ng in order to
make it available. That doesn’t make sense when running on a Raspberry-Pi.
A better solution is to collect the logs directly from the source, and send them
to elasticsearch. In this second part we will replace logstash-forwarder and
logstash with fluentd for collecting logs. We will add two systemd
services on each node that will keep track of the position in the journald and
send logs as JSON to fluentd using ncat. Fluentd will receive the logs
from our service and also collect logs from docker containers on each host
and add metadata from Kubernetes.
So let’s get started :)
If you haven’t upgraded to Kubernetes-On-ARM v0.7.0 and Kubernetes 1.2, do
that first.
I have created images for elasticsearch and kibana that can be found here:
If you want to upgrade elasticsearch to version 2.3.2 and kibana version
4.5.0 run the following commands:
$ # Warning this will remove your elasticsearch from Part 1
$ kubectl delete -f https://raw.githubusercontent.com/kodbasen/elasticsearch-kubernetes-armhf/master/elasticsearch.yaml
$ kubectl create -f https://raw.githubusercontent.com/kodbasen/elasticsearch-kubernetes-armhf/master/elasticsearch.yaml
$ # Warning this will delete your kibana from Part 1
$ kubectl delete -f https://raw.githubusercontent.com/kodbasen/kibana-armhf/master/kibana.yaml
$ kubectl create -f https://raw.githubusercontent.com/kodbasen/kibana-armhf/master/kibana.yaml
I found this solution from ianblenke and I have created a repo here: fluentd-kubernetes.
Here’s how to install the services on each node in your cluster:
$ # Install ncat first (apt-get install nmap or pacman -S nmap)
$ # Clone the repo
$ git clone https://github.com/kodbasen/fluentd-kubernetes && cd fluentd-kubernetes
$ sudo cp systemd/*.service /usr/lib/systemd/system
$ sudo systemctl enable journald-fluentd-pos.service
$ sudo systemctl restart journald-fluentd-pos.service
$ sudo systemctl enable journald-fluentd.service
$ sudo systemctl restart journald-fluentd.service
$ # You can verify that the streaming works by using the following cmd:
$ ncat -l -k 5170
The journald-fluentd-pos.service will keep track of the journald position
and journald-fluentd.service will follow journald in JSON format and send
the logs to fluentd on port 5170 using ncat.
The next step is to start our daemonSet, that will collect all logs on the node
and send them to elasticsearch.
$ git clone https://github.com/kodbasen/fluentd-kubernetes && cd fluentd-kubernetes
$ kubectl create -f fluentd-ds.yml
You should now see how your fluentd daemons are starting on all your nodes:
$ kubectl get pods
NAME                      READY     STATUS    RESTARTS   AGE
es-client-nrlbv           1/1       Running   0          2h
es-client-tm618           1/1       Running   0          2h
es-data-bvsqx             1/1       Running   0          2h
es-master-skdmf           1/1       Running   0          2h
fluentd-319fq             1/1       Running   0          16h
fluentd-41sml             1/1       Running   0          16h
fluentd-5kzt6             1/1       Running   0          16h
fluentd-86scv             1/1       Running   0          16h
fluentd-gqxr8             1/1       Running   0          16h
fluentd-rkod8             1/1       Running   0          16h
fluentd-u0vhl             1/1       Running   0          16h
fluentd-uqx3g             1/1       Running   0          16h
fluentd-zs06d             1/1       Running   0          16h
kibana-6rqgk              1/1       Running   3          2d
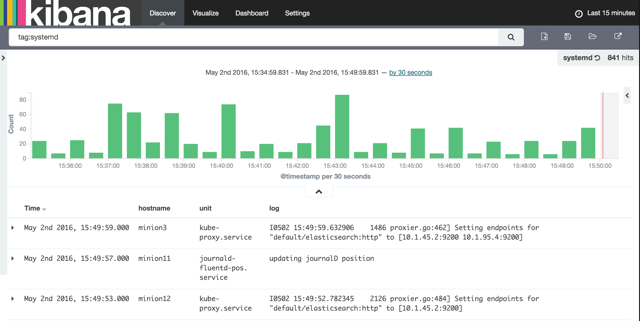
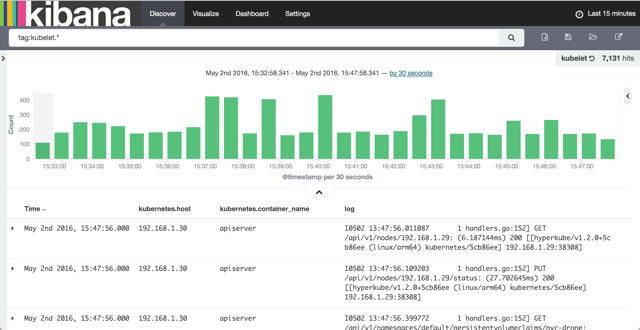
Our fluentd daemon accepts incoming logs on tcp port 5170 and tags them
with systemd it will also tail all logs found in /var/log/containers and
tag them with kubelet.*.
Open Kibana in your browser and you should see that your logs are beeing stored
in elasticsearch.
I’ve created two saved searches, one foreach tag:
Now we can collect logs from both PODS and nodes. But you will soon discover
that our nodes generates a huge amount of logs. Basically were running the same
software as on the x86_64 platform but with much less resources
(memory, cpu and disk). The old saying Silence is golden is very true
when it comes to logging. Our applications and components should only report
when something is wrong, and even then, the log should be a single line carrying
just enough information to identify the problem. If you take a look at the
stacktraces from elasticsearch and Java that is written to stderr, each
line generates a log message. A single error, written to stderr, with a
stacktrace can result in a huge amount of log messages. I leave it up to you to
filter out unnecessary logs and aggregate and combine multiple rows in to one
log message. All to minimize the noise.
2 May 2016 #Development #Docker #Kubernetes #Raspberry PI #Elasticsearch #Fluentd #Logstash #Kibana #ARM #Logging